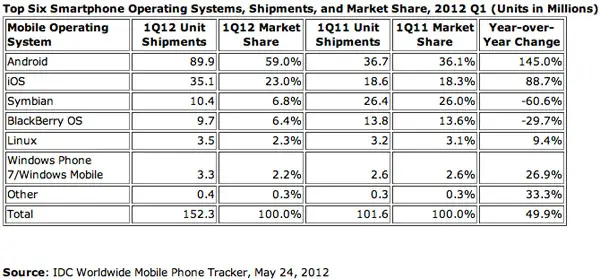
The smartphone war has turned into a two horse race as Android and iOS continue to grow their international hold on the mobile market while competing operating systems such as BlackBerry OS and Symbian continue to fall from relevancy. Android reigns supreme in IDC’s latest look at international smartphone sales with a 59 percent hold on the market in Q1 of 2012. Compared to a year ago, Google’s mobile OS is up about 26 percentage points. Pretty amazing growth.
Samsung is once again responsible for a large portion of the Android contingency with 45.4 percent of all phone running the OS coming from the Korean manufacturer. Samsung’s biggest competitor and legal foe Apple showed some positive growth with iOS now accounting for 23 percent of the world market. That’s up from 18.3 percent last year, but nowhere near the growth Android has experienced. Google and company have benefited from low-cost handsets that cut into featurephone sales and attract new users to the OS.
All things considered, Android and iOS now account for over 80 percent of all smartphones worldwide with the remaining 20 percent divided among BlackBerry, Symbian, Windows Phone, and Linux.
[via Engadget]


“The smartphone war has turned into a two horse race”
No it doesn’t, Android is miles (or km) ahead of the number 2! That’s not a race anymore…
With the addition of all the Nexus phones in addition to it’s regular Galaxy line, it’s not surprising they’re leading the way in the phone portion of Android OS devices. I wonder what their percentage is in the Android OS Tablet World.
Asus is King and Samsung is Queen
The Royal Joker is the iPad
I think Samsung is the King, no one ships more Android devices than them, maybe HTC is the Queen. The iPhone is the Joker
The tablet world is a different story, the iPad is sadly still the King, android hasn’t caught up to iOS in the tablet wars.
70% here we come!
sorry but fanbois will boast that’s because we’re 2 quarters away from an iphone5 release. Q4 of this year is when we’ll see real meaningful numbers.
1 quarter a year spikes aren’t meaningful numbers. Total yearly analysis is where the data really shows who’s doing well and who’s sinking.