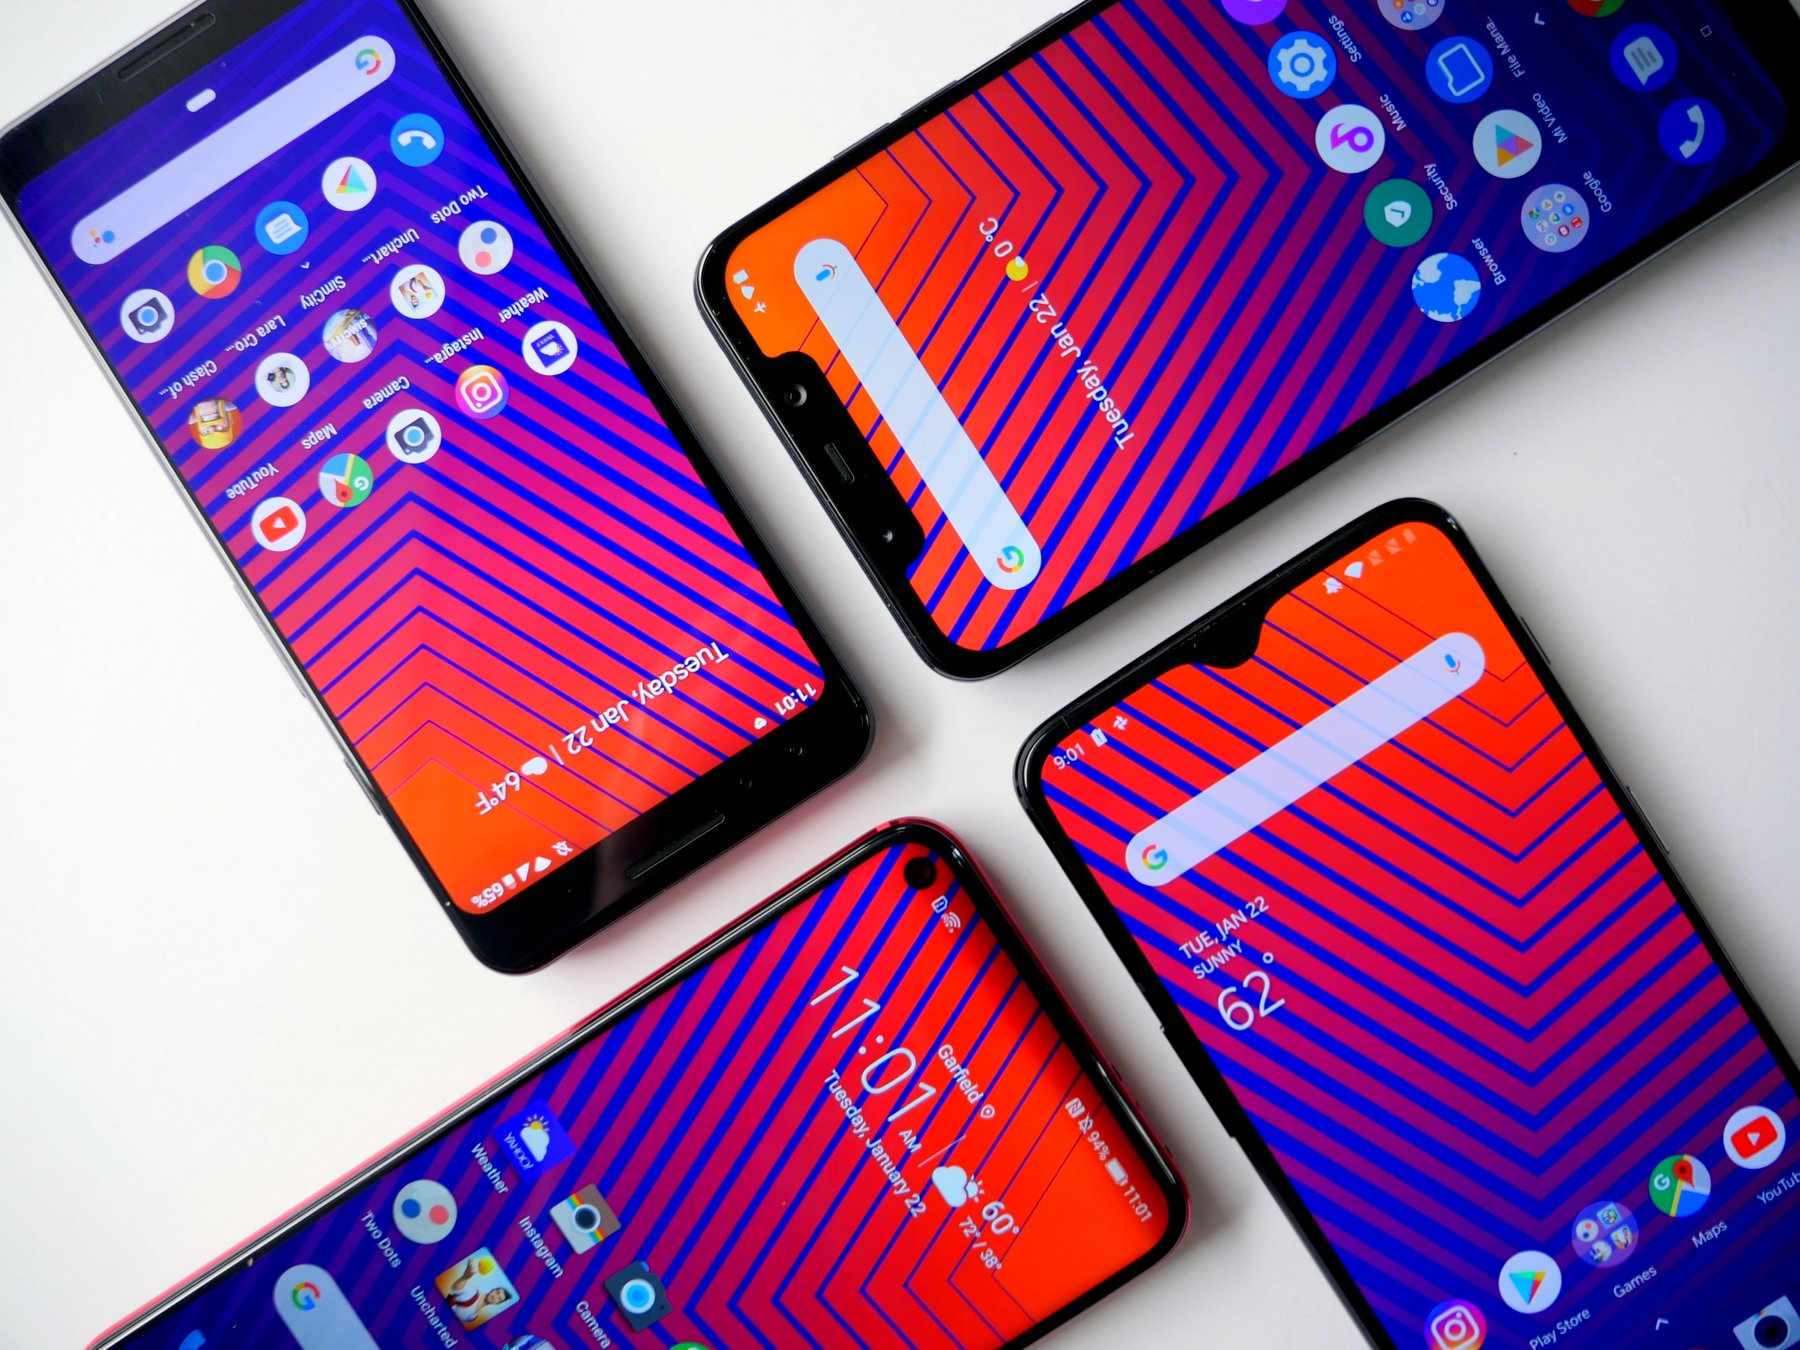
Believe it or not, we’re already one month into 2019. We’re halfway between CES and MWC which means we’ll be seeing a lot of new devices hit the market over the next month or two. While these new smartphones tend to get a lot of attention, we’d like to acknowledge that everyone who already owns a smartphone and give you guys an idea of what device regular Phandroid readers use on a regular basis.
Since our site is geared towards Android enthusiasts, that’s how we’ll be classifying our unique demographic. We’re sure that the numbers look a lot different on general tech sites or even mainstream media sites, but we can only report the numbers that we have.
For this months report, we’ll be comparing Phandroid’s analytics form January 2019 to those from December 2018. Doing this comparison is quite interesting since it does give us some insight into what devices were purchased over the holiday season which in turn has a negative effect on older devices as well.
The chart below shows the most popular mobile devices used to view Phandroid during the month and the percentage of overall mobile devices used to access the site. Unfortunately, we’ve had to exclude Apple devices from the report since Google Analytics bundles all iPhone models into a single entry. Other considerations that need to be made is the origin of the site’s traffic with (41% USA, 8.5% UK, 6% India, 3.6% Germany, 3.6% Canada, 2% Australia, 1.7% Philippines, 1.4% France).
Highlights from January
- THe Pixel 3 appears to be the most popular gifted smartphone over the holiday season, increasing its market share by 49% from DEC to JAN
- Samsung account for 6 of the top 10 devices, accounting for 11% of all mobile devices
- Despite a 17.7% decrease from DEC to JAN, the Galaxy S8 is still the most popular device
- Google’s Pixel 3 and Pixel 3 XL account for 3% of all mobile devices despite only being on the market since October
- Google’s full Pixel lineup accounts for 7.6% of all mobile devices
Most popular smartphones from January
| January | December | +/- Change | |
|---|---|---|---|
|
Samsung Galaxy S8 |
2.55% | 3.1% | -17.7% |
| Google Pixel 2 XL | 2.05 | 1.8% | +13.9% |
| Samsung Galaxy Note 9 |
1.95% | 1.9% | +2.6% |
| Samsung Galaxy S9+ | 1.9% | 2% | -5% |
| Samsung Galaxy Note 8 | 1.8% | 2% | -10% |
| Google Pixel 3 XL | 1.6% | 1.25% | +28% |
| Samsung Galaxy S8+ |
1.55 | 1.7% | -8.8% |
| Pixel 3 | 1.4% | .94% | +48.9% |
| Samsung Galaxy S9 | 1.3% | 1.6% | -18.7% |
| OnePlus 6 | 1.1% | 1.1% | 0% |
| Google Pixel 2 | 1.1% | 1.06% | +3.7% |
| Google Pixel | 0.8% | 1.2% | -33% |
| Xiaomi Note A5 | 0.75 | 1.1% | -32% |
| Pixel XL | 0.71% | 1.06% | -33% |


Comments