OpenSignalMaps Gives Us A Look At Android’s Fragmentation Through Their Eyes
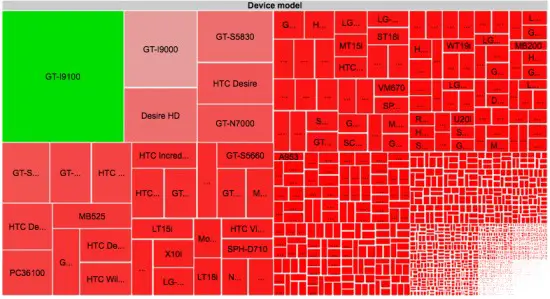
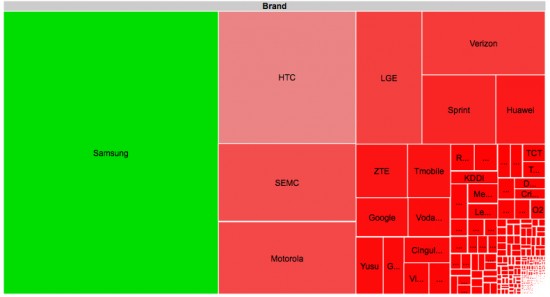
We hear it talked about a lot in the tech circles, but if you were hoping to get a glimpse of what Android’s “fragmentation” looks like, the boys at Staircase 3 have a nice graphic for you. These guys have been tracking 681,900 Android devices over the past 6 months that have downloaded their OpenSignalMaps (a network monitoring app) and this is what they’ve found: 599 distinct brands, 3,997 different Android devices, spanning across 195 countries. And that, folks, is why they call it the Android army.
Taking a look at the graphic, you can easily see which Android devices have the majority market share, with Samsung devices dominating the chart and their Galaxy S2, specifically, taking top honors among the distinct models surveyed. Keep in mind, this data — while nice to look at — isn’t exactly a complete and exhaustive study. The data is only taken from those that have used the OpenSignalMaps application and even then, custom ROMs can muddy up the data with unique “android.build.MODELs.”
While fragmentation gives users the option of choosing just about any device with the specs to fill their need, you can see that it poses a challenge on developers looking to make a single app tailored to fit them all. Would love to see more official statistics like these from the boys over at Google HQ. Would make it much easier to recommend Android devices more likely to receive updates based purely on market share.


